Citi Bike Rebalancing: Where to Send the Vans
Data Analysis
EDA
Geospatial
Exploratory data analysis identifying which bike-share stations most need active rebalancing.
Repository: View on GitHub
Problem
New York’s Citi Bike stations suffer from inventory imbalance throughout the day — some stations empty out or overflow depending on the hour — forcing costly logistical decisions about which stations to prioritize for van-based bike rebalancing.
Methodology
- Exploratory analysis with
pandas+seaborn: trip duration distribution, correlation by user type (Subscriber vs. Customer) - Time segmentation into hourly bands (
Morning_rush_hours,day_time_hour,evening_rush_hour,off_peak_hour) - Variance of usage per station across time bands — stations with high variance are the ones that fluctuate the most and need dynamic rebalancing
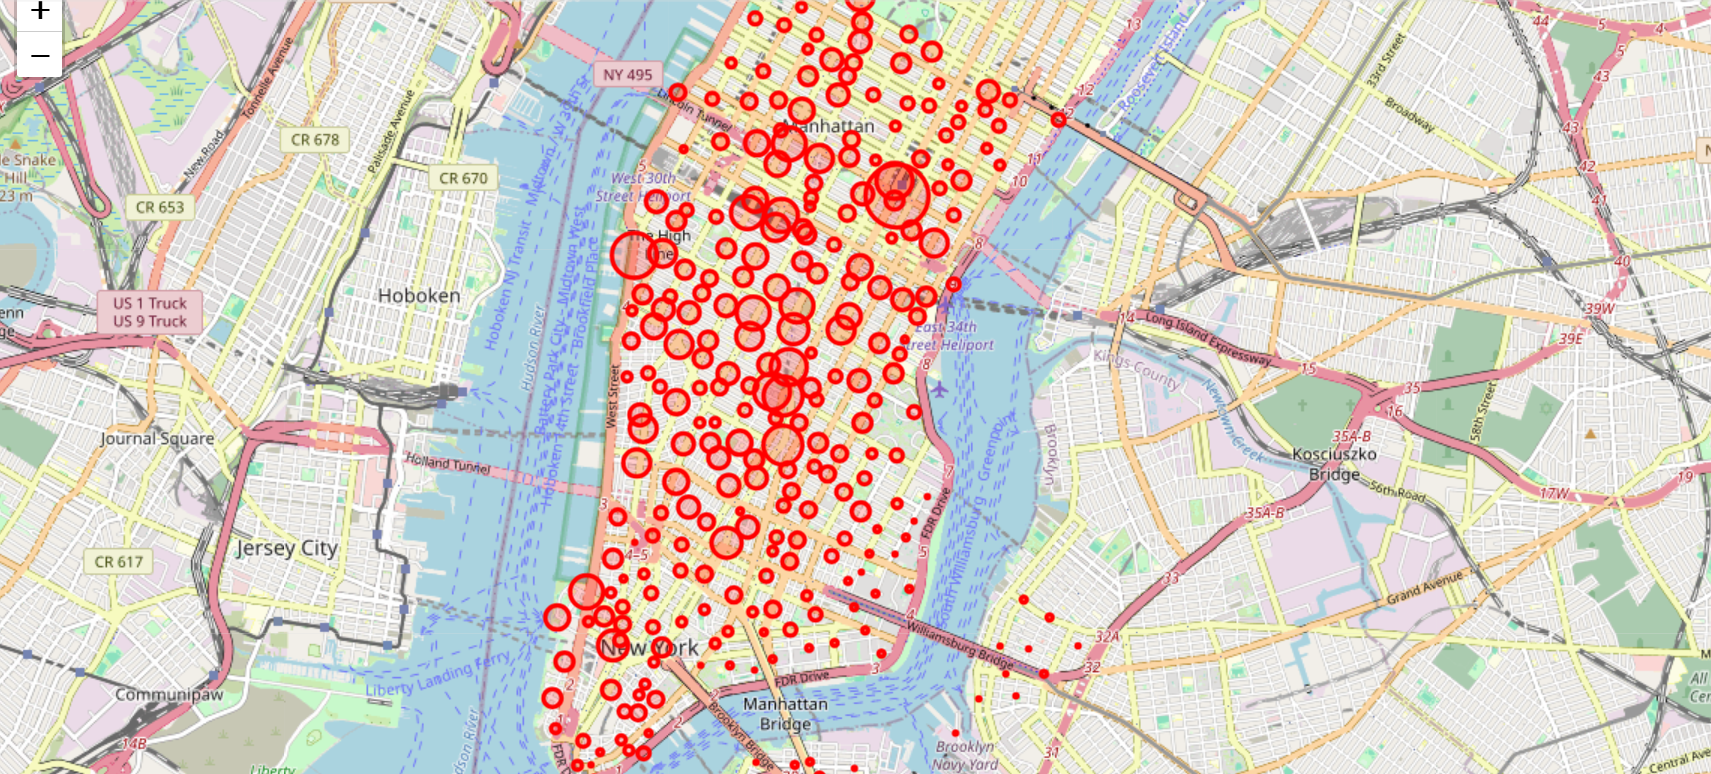
- Geospatial mapping with
foliumto visualize station popularity by location
df3['variance'] = df3[['Morning_rush_hours', 'day_time_hour',
                        'evening_rush_hour', 'off_peak_hour']].var(axis=1)
df3.sort_values('variance', ascending=False)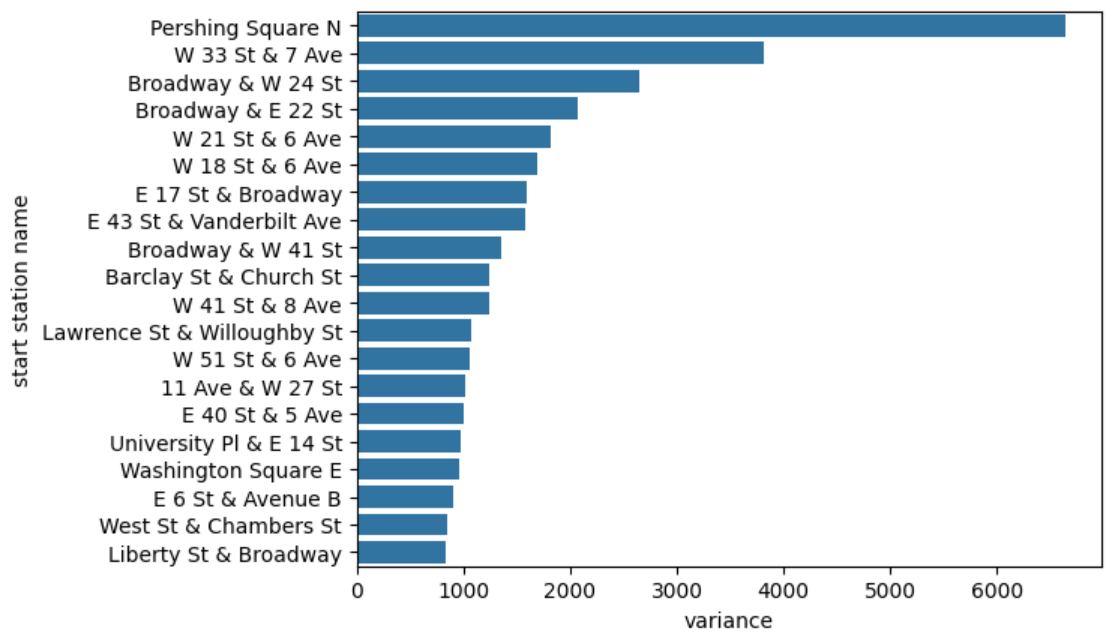
Results & Discussion
The analysis identified the 20 stations with the highest usage variance across time bands — priority candidates for active rebalancing, distinct from the stations that are simply the “most popular” by total volume.
Conclusions
- Total usage volume ≠ rebalancing need — variance across time bands is the correct indicator
- Time segmentation (rush hours vs. off-peak) is key for urban logistics decisions
- Next step: a predictive demand model per station/hour to automate route assignment